

- Debug tool
- How to download
- Hang or Black screen
- Reference
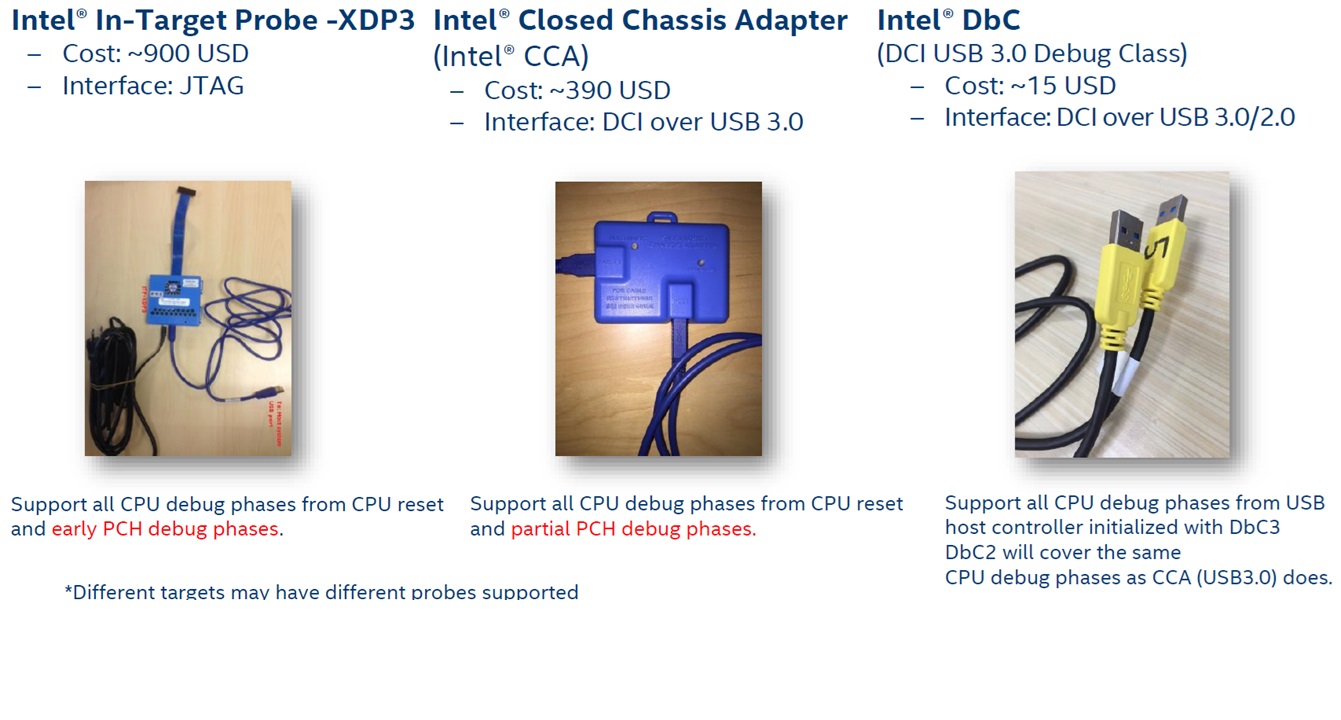
DCI USB 3.0 Debug Class,要加此其硬體上須如何配合等等
- 首先就是Platform 需要支援, 再來就是需要將待測機台DCI debug相關的token 開啟(BIOS & ME)
- 相關token可參考DOC#626623
- Debug 部分通常是用來針對CPU hard hang的現象(因為此時BIOS port 80h debug log通常會抓不到東西)或是用以觀察CPU C state , 若是BSOD則建議使用 Windbg 進行分析比較有效率
而CPU hard hang通常比較發生在CPU ES sample 階段, QS CPU後的階段通常比較少遇見 - CCA (藍盒子)價格部份之前是390美金 需要再另外確認
Debug tool
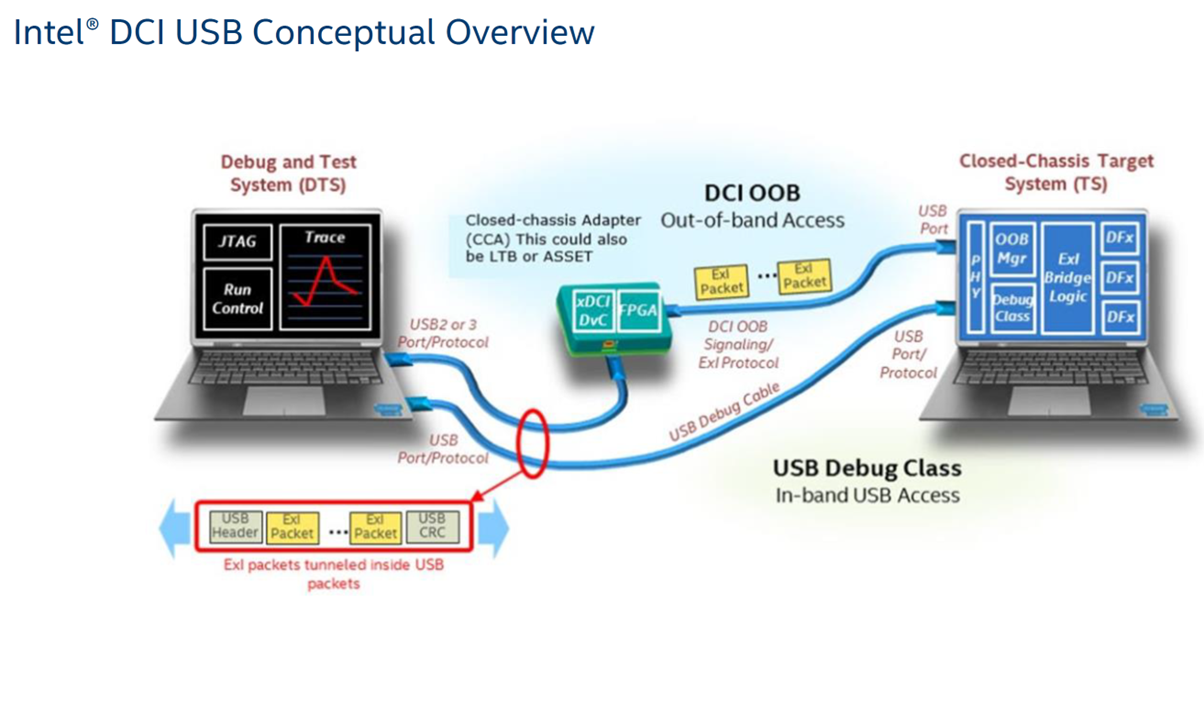
DCI(Direct Connect Interface)
How to download
- NOTE:
To access this download You must first register with the Intel® System Bring-up Toolkit NDA (formerly Intel® System Studio NDA)
Refer to #631579 and #616675
Command for collect crashlogs.
In C:\cscripts, enter “start_adl.bat”. -> start cscripts
itp.devicelist() -> Check DCI oob device on the list.
itp.status() -> Check CPU status.
itp.halt() -> Freeze CPU.
itp.go() -> Resume CPU.
crashlog.is_enabled() -> Check crashlog function is ready or not.
crashlog.parse() -> Capture crashlog.
crashlog.trigger() -> Trigger a fake crashlog.
-> Do not execute it before capture fail log.
ReferenceIntel® Platform Closed Chassis Debug User Guide
Intel® Direct Connect Interface (Intel® DCI) Enabling Guidance for OEMs
Intel® DCI enabling
評論